Simple Guide to Using Arthas
Here is the English translation of the Arthas introduction.
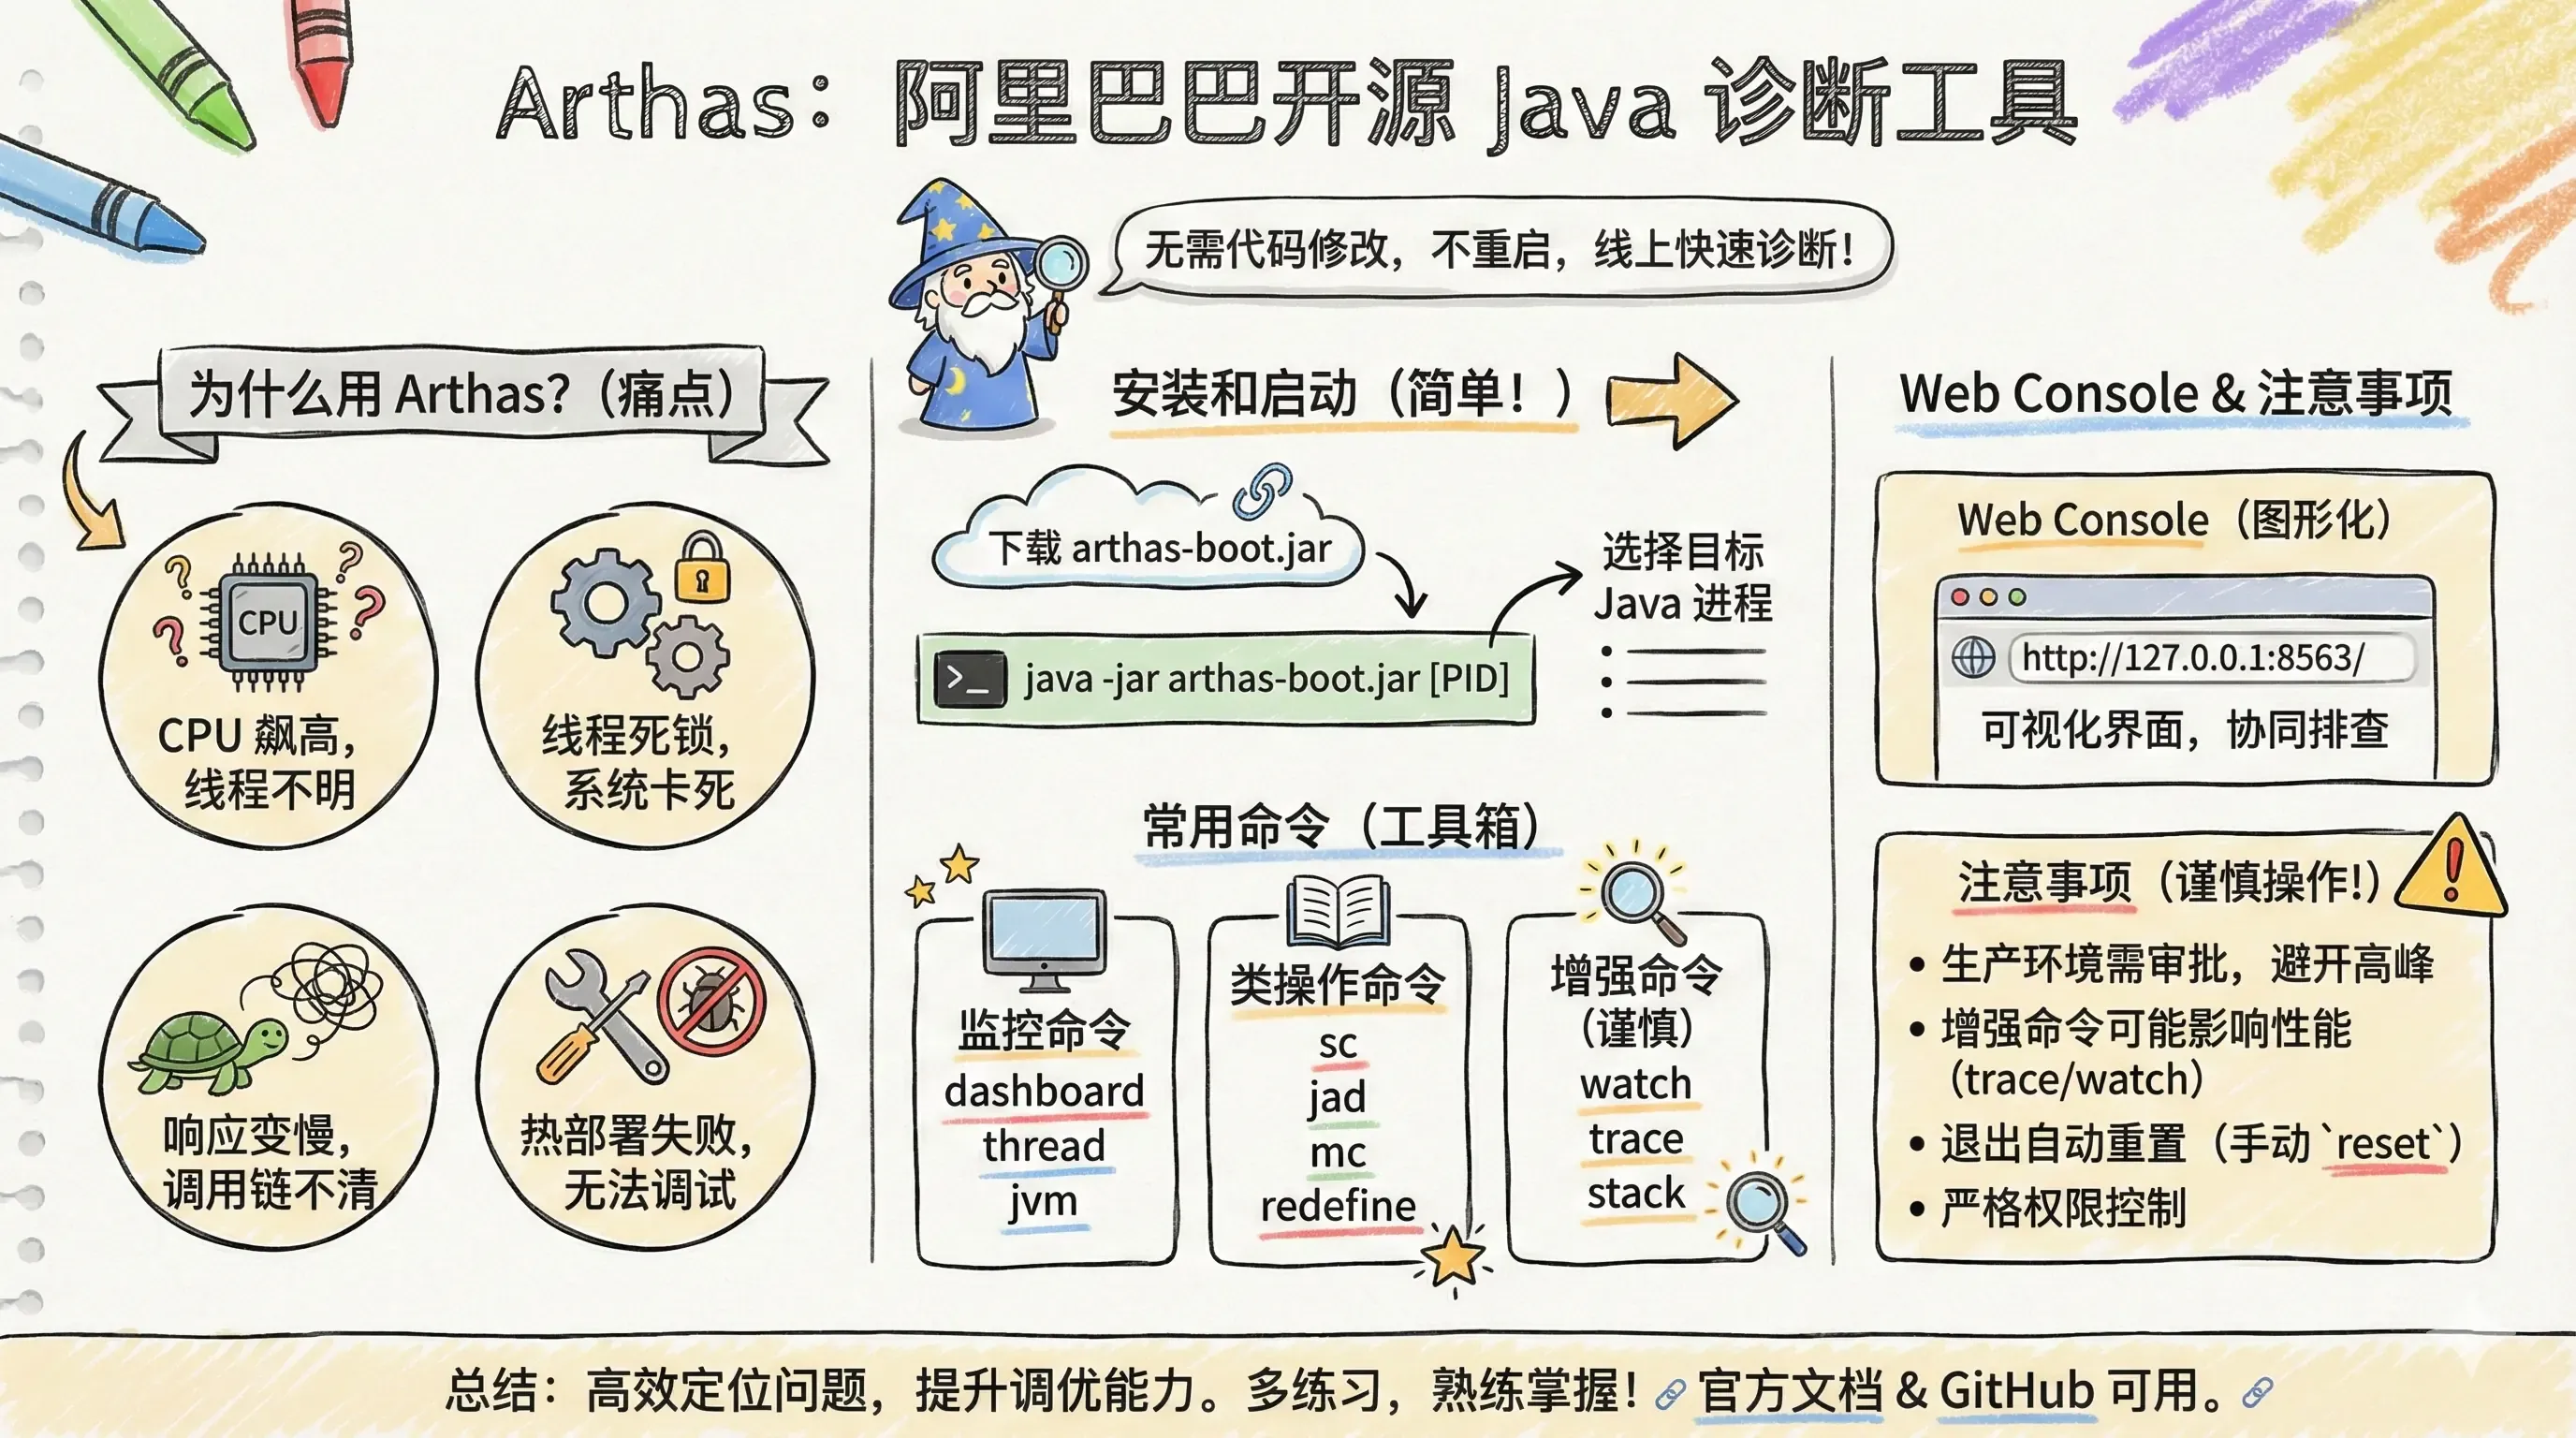
Introduction to Arthas
Arthas is a powerful Java diagnostic tool open-sourced by Alibaba in September 2018. It supports JDK 6 and above, provides a command-line interaction mode, supports multiple platforms (Linux/Mac/Windows), and features Tab auto-completion. Arthas enables developers to quickly diagnose and locate issues in online Java applications without modifying code or restarting services.
Why Arthas?
In daily development, traditional methods are often inefficient when encountering the following Java issues:
- CPU load is spiking, but the specific thread cannot be located.
- Thread deadlocks cause the system to hang, and it is difficult to view thread status in real-time.
- Application response is slow, and the method call chain is unclear.
- Online code is inconsistent with expectations, or code does not take effect after hot deployment.
- Remote debugging is prohibited in production environments, making it impossible to view variables in real-time.
- Lack of real-time JVM status and performance monitoring.
Addressing these pain points, Arthas was created to help developers achieve issue localization, real-time monitoring, and hot code updates.
Installation and Startup
Installation Methods
The simplest method is to download the official arthas-boot.jar:
# Download from GitHub
curl -O https://arthas.aliyun.com/arthas-boot.jar
# Recommended for users in China (Download from Gitee)
curl -O https://arthas.gitee.io/arthas-boot.jar
Startup Methods
Start using the java -jar command:
# Start Arthas and select a Java process
java -jar arthas-boot.jar
# Or specify the process PID directly
java -jar arthas-boot.jar [PID]
After running, it will list the Java processes on the system. Simply select the process number you wish to diagnose.
Common Arthas Commands
Arthas has a rich set of commands, which can be categorized as follows:
Basic Commands
| Command | Description |
|---|---|
help | View command help information |
cat | Print file content |
grep | Search for results matching criteria |
pwd | Return current working directory |
cls | Clear the current screen |
session | View current session information |
reset | Reset class enhancement status |
version | Output current Arthas version number |
quit | Exit the current client |
shutdown | Close the Arthas server |
Monitoring Commands
| Command | Description |
|---|---|
dashboard | Display real-time system data dashboard |
thread | View JVM thread stack information |
jvm | View JVM information |
sysprop | View and modify JVM system properties |
sysenv | View JVM environment variables |
vmoption | View and modify JVM diagnostic options |
perfcounter | View JVM performance counter information |
logger | View and modify log levels |
Class Operations
| Command | Description |
|---|---|
sc | View loaded class information (Search Class) |
sm | View method information of a class (Search Method) |
jad | Decompile source code of loaded classes |
mc | Memory Compile Java files into Class files |
redefine | Redefine loaded classes |
dump | Dump bytecode of loaded classes |
classloader | View class loader inheritance tree, paths, etc. |
Enhancement Commands
| Command | Description |
|---|---|
monitor | Monitor method execution |
watch | Monitor method input parameters and return values |
trace | Trace method call paths and time costs |
stack | Output the current method call path |
tt | Time Tunnel (Record method call parameters and returns) |
Practical Use Cases
Case 1: Locating threads with high CPU usage
thread -n 3
Locates the specific threads consuming resources and displays their stacks.
Case 2: Troubleshooting slow application response
Use the trace command to track interface method calls and identify the method taking the longest time.
Case 3: Viewing class loading information
sc -d ClassName views detailed loading information for a specific class, including the class load path and class loader, which helps in troubleshooting class loading exceptions.
Case 4: Detecting and fixing thread deadlocks
thread -b
Locates threads that are blocking each other (waiting for locks).
Case 5: Observing method inputs and return values
watch ClassName MethodName "{params, returnObj}" -x 2
View method call parameters and return values in real-time, facilitating debugging and understanding of business behavior.
Arthas Web Console
Arthas provides a graphical Web Console. After starting Arthas, access it at: http://127.0.0.1
/The Web Console functions identically to the command line, supporting command history and real-time feedback, making it convenient for team collaboration and troubleshooting.
Important Notes
⚠️ Production Environment Precautions
Arthas is a diagnostic tool. Use it with caution in production environments; approval should be requested, and operations during peak hours should be avoided.
Certain commands (such as
trace,watch,tt) modify bytecode, which may affect performance. Long-term execution may pose a risk of memory leaks.Enhanced classes are automatically reset when Arthas exits, or you can manually execute the
resetcommand.Strict permission control and operation log recording should be implemented when using it in production.
Relevant Links
- Arthas Official Documentation: https://arthas.aliyun.com/doc/
- Arthas GitHub Repository: https://github.com/alibaba/arthas
- Arthas Online Tutorials: https://arthas.aliyun.com/doc/arthas-tutorials.html
- Arthas Community Forum: https://github.com/alibaba/arthas/discussions